Latest: What the machines say now
- Aug 26, 2025
- 53 min read
Updated: May 4
MAY 1, 2026 UPDATE: A BROAD MARKET REBOUND
The market gyrations are currently in an uptrend. This is likely a result of the market hoping that the gulf conflict will be quickly resolved. Hope being the operative word. The good news is that the portfolio has recovered most of its recent losses and is only a bit over 1% below its recent peak. At the low, it was almost 7% from that peak, an uncomfortable, but not unusual decline.

JANUARY 30, 2026 UPDATE: A RE-ALLOCATION SIGNAL HAS OCCURRED
On January 29, 2026 InvestEngines generated a reallocation signal moving towards the more balanced profile of the benchmark portfolio. Over the past months starting earlier this year, gold, emerging market and developed markets outside the US have outperformed US equities, more dramatically in the recent months. Although the benchmark had begun to outperform the model portfolio, returns over the past year were similar until now as the excess return of the model has rolled over. Below is the new allocation along with the relevant performance data. US equity holdings have been reduced, while ex-US equities have been increased, along with emerging markets and bonds. It is now a more cautious allocation and given the recent upside performance, as well as growing geopolitical uncertainty, not surprising.

I normally don't dig into the why's of market behavior, but this past year has provided some apparent drivers. The dramatic drop and recovery in the spring of 2025 coincides with the announced tariffs and subsequent roll backs. The recent surge in emerging markets, gold and developed markets outside the US, coincide with the "sell America" sentiment that has emerged and has been front and center in world wide media. Whether this will persist remains to be seen, but hopefully the shifts in market behavior will be slow enough for the learning machines to react as they have for the past 30 years. If not, there are lessons for the machines to learn and embed.
DECEMBER 10, 2025 UPDATE: STEADY AS SHE GOES
The models are unchanged and US equities are still over-weighted and returns have all recovered from the big drop at the end of last year. In spite of all the uncertainties, returns are now near or above long term averages.

JUNE 16, 2025 UPDATE: WHAT JUST HAPPENED PART 2
The past few months have been a crazy and concerning period; on again, off again, on again tariffs, domestic challenges along with escalating middle east conflict. It is all reflected in a volatile market, although the InvestEngines allocation models have not flinched, yet. Below is the latest update with a few edits to put things in better context.

Included in the new table is a fourth column that shows the performance of the engines over the 20 plus year training window so that you can compare current performance to history. Also, there are now best fit linear trend lines so the cyclical nature of returns are clear. All models have shown a return to their longer term averages following the major drop that occurred when tariffs were initially announced. As you can see the benchmark shows less volatility with less return, while the more aggressive allocations show greater return along with greater volatility. Until there is clarity regarding inflation, the FED and geopolitical stability, I expect more of the same.
MAY 2, 2025 UPDATE: WHAT JUST HAPPENED
The tariff announcement in early April hit the markets hard and the benchmark allocation has outperformed for the past 3 months. The learning machines ignored it all and have held asset allocation steady. Some recovery has occurred over the past few days. It’s unsettling, but to be expected from time to time. More on that later, but first lets look at the updated snapshot below.

As you can see the benchmark return is positive during the last 3 months, while the learning machines were negative. They are recovering a bit since. The allocation of the learning machines has not reacted yet to the tariff shock. They are still holding the same allocation; over weighting US equities. More diversification has offered some protection for the moment.
The average 30 month performances of the models as well as the benchmark portfolio are close to their long term 20 year averages. So over that time frame the learning machine still outperforms. That is a small comfort, so its worth drilling down to understand how often and when to expect this. Over the past 20 plus years of the training window, the benchmark allocation ((60/40) will beat the model 40% of the time, but over 3 years the learning machine will outperform the benchmark around 85% of the time. You can see this most clearly in a chart from the "Details" article below.

The graph below is the cumulative net excess return of the learning machine allocation model relative to the benchmark portfolio over those past couple of decades.

Upward sloping periods indicate the models are outperforming the benchmark. Negative slope indicates the opposite and flat periods indicate similar performance of the models relative to the portfolio.
There have been a number of instances when the more diversified benchmark has outperformed the model to a lesser or more significant degree. And it usually occurs following periods of out-performance of the benchmark. The times worth examining are those moments of dislocation in market dynamics: the tech bubble burst, 911, the financial crisis, the FED’s 2018 rate increases, and COVID. You can easily see those periods when the models performance relative to the benchmark declined abruptly.
The period from November 2022 to the present (May 2, 2025) is shown below. That graph displays the cumulative net excess of the learning machines relative to the benchmark over the past 30 months (the rolling update time window).

The precipitous drop that occurred over the recent 4 months is obvious. The market seemed to sense things in February based on expectations. But the sharpest decline occurred in April following the more detailed announcements. You can also see the beginning of the recovery when some of the delays and negotiations were announced.
COVID market behavior seems akin to what we have experienced so far with the tariff shock, both in magnitude and how the learning machine portfolio performed relative to the benchmark. Below is the cumulative net excess of the learning machine for the period leading up to and immediately following the largest market drop that occurred as COVID's impact became apparent.

As you can see this looks a lot like what has happened recently regarding the tariff announcement. The good news is that the benchmark and the learning machine allocation delivered returns of 12% and 16% respectively over the following 12 months. Perhaps if the tariff negotiations produce positive results we can experience similar good times.
Uncertainty about what happens next is paramount and there is no way to accurately forecast it. The lesson to take is that broad and balanced diversification can help, but will cost you return over the long run. Pick your poison.
One question you may ask, can the learning machines be improved to avoid or reduce these sudden market drops. The learning machines tested multiple shorter and longer reaction time constants. For the 20 plus years of training, the machines settled on the current values as optimized (maximizing the uniformity and range of returns).
As I have noted in a previous article, the rate of change in market behavior has been accelerating over those 20 plus years and it may be worth factoring that in to future learning machine parametric variables. I do expect any potential gains to be modest and will likely come at the expense of more potential allocation churn than desirable for the long term investor (as opposed to the more active trader). I wish the models could predict the future, but they can’t. If corrections like this are too much to bear, diversify more fully toward the benchmark allocation or add cash.
Speculating on the range of outcomes as we move forward over the next few quarters is a fool’s errand, but why not.
Let’s start with a worst case; the prospect of stagflation. That is a very bad scenario. The learning machines have not encountered that in the training data. The FED will be stuck; its tools are not optimized to handle it well, if at all. Both equities and bonds will be hurt. It is possible that ex-US global and even emerging market equities may be a bit sheltered, but that is very uncertain. Precious metals (e.g. gold) may offer safe harbor, but are volatile and gold has had a huge run up already over the past year. One asset class not included in the model training data is cash (e.g. money market funds).
The best case is that the tariff “wars” are quickly resolved with a more stable and predictable world economy emerging. The most probable scenario is continued volatility and uncertainty until clarity returns.
FEBRUARY 1, 2025 UPDATE: BACK TO THE FUTURE
The 2 smaller engines that went from diversified to over-weighting the long bond in December, have switched back to full diversification and the overall allocation is unchanged for the past 10 months. The bad news is that it was an unnecessary signal based on a hard threshold set in a noisy environment.
This event points to the issue of noisy incoming data. The asset price data is from public sources and uses historically adjusted price. This means that dividends are included (and assumes one reinvests all dividends) and the past pricing history reflects the latest dividend data. It’s a cautionary tale about reacting instantly to any indicator and I need to address that issue in a better way. Treat the engine output as a broad indicator and plan accordingly.
As shown below we are essentially back to the same allocation we have had for the past 10 months; still over-weighting US equities. Performance has remained consistent.

January of 2025 has introduced at least 2 events worth noting: the DeepSeek announcement and the new administration. I’ll be brief. It appears DeepSeek used distillation. That is a term where a large language model (LLM) can “teach” a smaller one, saving a great deal of development resources. This has been a surprise to the market, but recent industry research may have anticipated that possibility. AI has been in peak hype mode for some time. This event may help set more realistic expectations. AI is a very big deal that will have profound consequences for all, but the path forward is never clear. Uncertainty is here to stay.
Speaking of uncertainty, recent shifts in the geopolitical and economic landscape are adding to it. Where it leads is anyone’s guess. I can envision any number of scenarios. The data implies that inflation has declined, but is still here and above where it needs to be. It could get worse and has already done a lot of damage that is not going away. I’m glad to have InvestEngines as a guide to an asset allocation dynamic that is anything but predictable.
JANUARY 8, 2025 UPDATE: HAPPY NEW YEAR
The New Year has begun and there is a new update to the models. About a week ago, in late December, two of the lesser weighted models shifted from a fully diversified state to over-weighting the long bond. This in turn raised the overall long bond while maintaining US equities overweight. The predominant model has not changed its overweight to US equities as has the most aggressive partially leveraged model, which has had no allocation to any levered asset classes in the entire reporting period.

US equities have had a huge run over the past few years. As mentioned in the previous update the historical data suggests an average portfolio year ahead, with an average range of probable outcomes. The long bond has under performed in the same period and has been under-weighted in the model portfolio. Maybe it’s time in the sun will come as indicated by the recent reallocation. A lot hinges on geopolitics, inflation, interest rates and the FED. Bloomberg recently published its survey of expert predictions for 2025. In some of those prognostications, the “experts” suggest the FED is prepared to move further down the interest rate scale if employment numbers indicate a slowing economy. We shall see.
I should note that some very minor tweaks were made to the models to keep them self consistent with historical update metrics. This is to make sure that the past can’t be changed due to reporting data inconsistencies. This is a bit of remaining issue with the data sources and how the models can be affected and is something to watch and resolve.
Also, the graph of the different portfolio models always begins the rolling reporting period normalized to a value of one. This provides a clearer relative picture of comparative performance.
OCTOBER 25, 2024 UPDATE: NO CHANGE TO ASSET ALLOCATION
There has been no change to the InvestEngines’ suggested asset allocation which still significantly over-weights US equities. It’s been a strong year in the market. We are riding a nice long recovery from a market bottom caused by the pandemic.

The recent 12 month return of over 25% for the 4 engine portfolio is about twice the long term average. This level of 12 month performance only occurs about 2% of the time, so it’s not likely to repeat anytime soon. Getting a sense of what may lie ahead means looking at some more numbers that happen more often.
Over the past 20 plus years a monster 12 months like we have just enjoyed has been followed by a subsequent 12 month return of at least 5%. And about 40% of the time that return was 12% or more. Given how rare last year's performance was it is worthwhile to examine a more frequent precedent like the prior 30 month performance which falls close to the average as it just did.
The 4 engine allocation engine has delivered at least 5% return for the subsequent 12 months 96% of the time when the previous 30 month window delivered average returns. It has delivered a return of 12% or greater 45% of the time and has only been negative 3% of the time. So in spite of the very high return (27%) over the last 12 months and average returns over the past 2.5 years, the odds are still even for average returns for the next 12 months. There is a small chance (3%) of negative returns and definitely don’t expect another 25% upside, only 3% chance of that.
All that said, this is a strange time with heightened geopolitical risk, and these probabilities are just that. And the election is close at hand. And don’t forget that old trading adage: “buy the rumor, sell the news”. Hmmm.
AUGUST 3, 2024 UPDATE: NO CHANGE TO ASSET ALLOCATION
There is no change to the current asset allocation, but there has been a sudden shift in perceptions about the economy and potential FED moves over the next several months. This week the FED did put a September rate cut on the table and then the softening employment data reinforced that possibility. The market response was swift and dramatic with a marked drop in equities and equivalent rise in bond values. The learning machines will not respond to rapid market moves or implications of FED future actions, but there are indications that point to a future shift away from the current asset allocation to one that will increase bond weighting. Stay tuned.

Note that currently there is no allocation to any levered funds, the levered machine is currently in non-leveraged US equities and the "weighted all machines" reflects the increased allocation to US equities.
JULY 5, 2024 UPDATE: NO CHANGE TO ASSET ALLOCATION
Geopolitical uncertainty throughout the world and in the US are not conducive to macro market stability. US equities have had a good run relative to other geographies and to US bond returns, but that tide may be turning, or not. Only time will tell.
The past 12 months have generated returns close to long term averages. The past 30 month period, which includes negative impacts of rising inflation and FED fund increases, are still lagging behind their long term averages.
Peering under the hood of the machines there is the beginning of a trend that would point to the long bond as a more favored asset class at some point in the future. With so much uncertainty about US interest rates, the economy and global instability, that could change. Stay tuned.

Note that although the weighted machine includes the leveraged engines, there is currently no leverage funds allocated from those machines at this time.
MAY 15, 2024 UPDATE: NO CHANGE TO ALLOCATION
Asset allocation has remained unchanged since the previous update, with US equities still over-weighted. The past 12 months have generated close to long term average returns. The past 30 months, which includes negative impact of rising inflation and FED fund increases, are still lagging behind. The current trends indicate that in the near term there is a low probability of a significant re-allocation, but with so much uncertainty about US interest rates and the economy and global instability, that could change.

Note that the 30 month average is the average annual return over the past 3 years.
MARCH 9, 2024 UPDATE: A CHANGE TO THE MODELS
A few months ago (January 9th) the 4 engine learning machine triggered an allocation change that over-weighted the long bond. As I noted then, it seemed to have occurred sooner than I expected this year. My expectations were based on two observations, one was looking inside the learning machines and the other was seeing qualitative developments in the market, specifically whether interest rates would move lower. Regarding the qualitative market expectations of the FED, it still seems uncertain if and when rates will move lower. When I took a deeper look under the hood of the learning machines it was clear that the threshold to move from over-weighting equities to bonds was getting very close, but the exact moment was not knowable. In January the engines hit that threshold sooner than I expected, but since that time I have had a sense that it was still premature. So I decided to look deeper.
Without getting into the weeds, I decided to reexamine the historical training data (which ended in 2021). Specifically, the question was if more granular neural weightings could improve historical outcomes. The original work limited the granularity of the weightings for practical constraints on compute time. And that is still a real constraint. So I focused on the one engine and on the two specific weightings that have had an over-sized impact on outcomes. The goal was to see if a more granular weighting found a higher utility function local maxima.
By adjusting those weightings by very small amounts the total training utility function local maximum was slightly raised. Importantly, there was also a small benefit to average returns over the 20+ year training window. This is a cautionary tale which raises the possibility that the current models are not operating with the ultimate peak utility functions. To refine the training granularity for all weightings on all engines is beyond my computing capacity. It will have to wait until someone else, at some time, with more resources, chooses to explore this question and all the others that remain.
Applying those small changes to the one weighting of the one engine however did have a notable short term effect. The timing of the most recent signal has not changed, but that January 9th re-allocation went from well diversified to over-weighting US equities rather than bonds. The current performance and allocation data is shown below. I will be incorporating these newly refined weightings going forward. If there are ever any other improvements or refinements to the models, they will always be announced here in the “latest tab”.

MARCH 1, 2024 UPDATE: NO CHANGE TO ALLOCATION
Same asset allocation since the January 9 change, which was the first change in 8 months.

JANUARY 19, 2024 UPDATE: WHERE THE FIGAWI IN 2024
Well January brought an early surprise. The learning machines have recently (January 9) triggered an overweight in allocation to the long bond. Although I anticipated this at some point (peering under the covers of the machines), it came sooner than expected. The underlying dynamics of equities relative to bonds are balanced and weightings could change again over the next few months. The modeling of the leveraged machines are all in US equities. This latest data is seen in the updated images below. There is so much uncertainty about inflation, FED rates, economic strength and geo-political instability I decided to do a deeper dive. Article 14, titled "Where the Figawi" explores these questions in more detail.


NOVEMBER 10, 2023 UPDATE: STRANGE TIMES
With all the geopolitical uncertainty here and abroad it is difficult to be sanguine about what the future holds. The market seems to be doing reasonably well, even with another government shutdown looming and the FED path forward still uncertain. The learning machines have held steady in a fully diversified state as shown below. Over the past 25 years, when in this state, portfolio annual returns have averaged in the high single digits.

In Article 13, "Running with Scissors", I explored the use of leverage within the context of learning machines and have decided to include those results in these updates. Leverage seems antithetical to the goals of a macro/conservative long term investor. However, applying learning machines showed the potential of a net benefit. A surprising result for sure.
At this update the levered learning machine portfolio is not levered, but instead is 100% allocated to non-levered US equities. During the last 20 years those periods when fully allocated to non-levered assets, the portfolio has averaged annual returns in the mid teens. Below is the current allocation and performance of combining the non-levered learning machines with the levered version.

OCTOBER 6, 2023 UPDATE: MORE OF THE SAME AND SOMETHING NEW
The recent volatility and uncertainty about the economy, inflation and the FED have left things up in air. There has been little change to portfolio performance and no change to asset allocation as shown in image below.

But there are two items worth discussing. One is the fact that the stop loss engine got within a fraction of 1% of a threshold to get into cash that would have avoided the bulk of the recent market decline. Only time will tell if this will lead to a long term benefit. The implication is that I will consider displaying a cautionary metric to provide greater insight when any stop loss threshold is approached, but not passed.
The other item to discuss is the state of the leveraged portfolio, which is currently all-in on a non-leveraged US equity asset allocation. The leveraged machine has outperformed the benchmark learning machine in the recent year (16.4% vs 4.4%), although just marginally outperformed in the past 30 months (1.2% vs .4%) largely due to market volatility when the FED began aggressive rate increases. It was surprising to see that over a 20 year span a small (10% to 15%) overall weighting to the leveraged engine to the non-leveraged benchmark, not only raised long term returns from 12% to 15%, it did so while raising the RSQR value (less marginal volatility relative to long term returns), which was a surprise. I will be looking to develop a more nuanced set of metrics to give greater insight for market positioning, including "cash" and leverage.
SEPTEMBER 1, 2023 UPDATE: SAME OLE, SAME OLE

Nothing of great impact to report. Recent gains are subsiding while the market awaits data that clarifies whether a soft landing is in our future and hope that the FED rate profile becomes clearer. I have added a new article. Number 13, titled "Running with Scissors". It is a discussion of leverage, which should be considered off limits for the typical long term investor. But an appropriate AI might alter that perception. So check it out.
JULY 1, 2023 UPDATE: STEADY AS SHE GOES

No changes since the April update. The worst of the turbulence from the FED's raising rates seems over. If the trends that occurred over the past decades repeat to some degree, we should expect a period of full diversification, followed by a period when bonds will rise to the fore. But a lot hinges on what happens to inflation and the FED's moves. Currently, there is an expectation that there will be 2 more interest rate increases before more pauses. But if inflation does not show a significant move down toward 2% and the economy/labor/market stay relatively robust, the move to favoring bonds will be delayed and equities may continue to perform well. If the FED overdoes it, and then eases aggressively, it could be bonds time in the sun.
I decided to revisit the coarse short term predictor model first discussed in Article 10, "Climbing further out on a limb". Below is the latest chart with data that ends in June.

Two things stand out: the market began anticipating the FED's interest rate actions and then reacted dramatically to the reality (although the earlier spike up exacerbated the 1 year negative performance). The market bottom looks like it occurred at the end of the 3rd quarter. Since then it has recovered faster and to a greater degree than any of the previous large market drops over the past 25 years (see the April 10th update below). The predictor is lagging, but the trend seems correct. If so, there may be a bit more upside as the predictor suggests a peak within a quarter from now and a new bottom early 2025 or later. Hopefully, returns will be less volatile as inflation settles down and recession probability becomes more apparent. The allocation engine went from over-weighting US equities to fully diversified in April.
APRIL 18, 2023 UPDATE: RE-ALLOCATE SIGNAL OCCURRED!

As mentioned in the previous update (April 10, 2023) the expected re-allocation to a fully diversified portfolio (equivalent to the benchmark allocation) occurred this week. It comes at a time with more uncertainty about the market. Expectations are now squarely in the camp that the FED will continue raising rates a bit more before pausing. If inflation continues to decline and the FED pauses, it will be neutral to positive for bonds. If the decline of inflation is modest and the expectations for a prolonged period of slowly declining rates, and an associated decline in business, then the muddle through scenario will emerge, with diversification playing a more important role. All this comes after a very long run of over weighting of US equities as shown in the top graph. And the most recent period of benchmark matching allocation was the 2 year period including 2010 and 2011, when average returns were in the low single digits.
The only respite from the long run of US equities was a brief period when the stop loss engine exiting the market entirely, and visible as a flat period in the purple line of the InvestEngines portfolio performance below.

APRIL 10, 2023 UPDATE: Uncertainty continues

Things are still uncertain. It is still largely a 50/50 question as to what happens next. We are well off the recent October bottom for the SP500, the FED is moderating interest rate increases, but inflation remains elevated, slightly below its earlier high, but not declining significantly. The rapid rise in interest rates has triggered some banking failures and the fear of contagion has risen, causing some increased volatility.
Qualitatively, if there are further bank failures, or extraordinary rescues, then it is clear that the market will hit another period of higher volatility. If tighter bank lending negatively impacts the economy it will potentially lead to further slowdown or contraction in the economy. If that contraction is accompanied by falling inflation then the FED will pause, or possibly begin to lower rates. If inflation does not moderate, than the FED may hold rates in the 5%+ range for some period.
Quantitatively, the lnvestEngines’ models can offer some guarded insight. The asset allocation engines, for their worth, have held the line on over-weighting US equities. Looking under the hood at trend lines, it is only a matter of several more months before a more fully balanced diversification move is in the cards. It is also quite possible that the long bond’s return to overweight will occur.
The stop loss learning machine, operating on the InvestEngines' portfolio, briefly jumped into cash for a couple of months beginning in April of 2022. It then jumped back into its previous allocation of equities and bonds. That move did generate a net gain (the purple line as shown in the upper left graphic).
The plot shown in the lower left is the coarse “predictor” discussed in the “Big Market Bottoms” article. It was created with a machine learning set of metrics built from the LEI (leading economic indicator) and interest rates. Updated from last month, it still indicates that the market could possibly be improving soon. But the indicator is not perfect and could be early by 6 months to a year or more.
Finally, looking at historical market declines for comparison can be bit unsettling. I’ve superimposed the current SP500 performance since its peak in early 2022 against 3 previous periods of massive declines from market peaks: the tech bubble, the financial crisis and the inflation period of the 70’s. It is clear that we are at a potential inflection point. In earlier articles here, it became quantitatively clear that the 2020's could be a decade of well below average returns.
Stay nimble.
MARCH 3, 2023 UPDATE. In February the FED raised rates another .25% and set the stage for another interest rate increase in March as inflation has stayed elevated. The press conference language was slightly more dovish than in recent meetings and the market responded accordingly with a rapid jump. But non farm payrolls showed a much stronger number than expected. (Note that those gains could be partially attributed to seasonal adjustments.) A strong labor market gives the FED more runway to continue to raise rates until inflation shows real contraction.
There is still a great deal of uncertainty going forward. The market has come off its October bottom and has reached almost half way back to its previous peak. The learning machine is maintaining its current asset allocation. It too has recovered from the October bottom and is about half way back to its peak. But in key ways, this still looks similar to the tech bubble market crash. We are still over valued and coming off near historical valuation highs, not seen since the peak of the tech bubble. Back then market rallies like this occurred over several years before a final bottom was made. If that scenario repeats, we could see a bottom of the SP500 in the low 3,000's or high 2,000's, a big decline from where we are today.
The "flat" area in the value line of the portfolio (purple line in the top graph) was the brief period when the stop loss engine actually jumped out of the market and then back in. It did generate a net excess return and avoided the October low. However, it is an extreme action that very rarely pays dividends and only seems to be of benefit with the kind of input stability that the InvestEngines allocation engine can provide. In fact, during the market crash following the tech bubble the stop loss engine never exited the market. Interest rates were much higher then and as the market fell, bonds offered much greater returns and the learning machine allocation engine had over weighted long bonds and offset those equity losses. For a full description of this, see article 7, here titled "Details" and article 9, here titled "Lagniappe".
The contrarian "predictor" engine (red line) shown in the graph above does still indicate that October could have been the bottom, but it is not a perfect indicator by any means. For a full explanation of the "predictor" see the InvestEngines article 12, "Big Market Bottoms (and Tops)" .
NOVEMBER 2, 2022 UPDATE: INFLATION AND THE FED
The most recent data of interest are the PCE (Personal Consumption Expenditure, which is one of the metrics the FED watches to measure inflation) readings on October 28 and the FED actions on November 2. The PCE still above 5% and although flattening, is not coming down appreciably. The November rate increase of another 75 basis points brings the FED rate to between 3.75% and 4.00%. So inflation is still higher than the FED rate. Bottom line is we will very likely see continued rising FED rates (although more slowly) until we see positive real returns (meaning the FED rate is moving higher than inflation) and inflation is stable or coming down. When market expectations reach that point, it will be positive for equities and bonds. Until then we may bounce around the big market bottom.
OCTOBER 11, 2022 UPDATE: MORE WARNINGS
The SP stop loss engine indicates if the SP drops another 5% or so, a much larger future decline in the SP is likely as is the possibility of another sell signal. That combined with the fact that the benchmark portfolio stop loss engine just gave a sell signal on 9/19, should be cause of increased caution.
For the first time in the past 25 years the allocation engine is in unknown territory. The portfolio allocation engine training data has never encountered a period of rapidly rising interest rates from a period of near zero rates. That means that the benefits of diversification into bonds for safety have not provided the back stop to losses in equities. Likewise the training data of the stop loss engine operating on the portfolio has not experienced the current level of extremes in its performance.
The portfolio’s worst 1 year performance of the learning machine’s stop loss protected performance in the training data was a decline of - 7% and a peak to trough decline of -14%. But as of this writing the past 12 months have seen a portfolio decline of -13% and the peak to trough decline of -18%. Alarm bells are ringing.
The reason is not surprising since the training data has never encountered current market conditions. I had previously built a 4 layer stop loss engine that uses almost 100 years of historical data of the SP index to expand the range of market conditions for training. Estimating the benefits of using such data within the allocation engine indicates it would have improved things. Those estimates indicate that the current 12 month and peak to trough performance of the portfolio would be about -7% and -13% respectively, which is within the extremes of the original portfolio's performance.
I will write a more complete article addressing all of this in the near future. And in that article I will dive deeper into the statistical aspects of market bottoms and recovery profiles that may inform today’s expectations. Also, I plan to incorporate a pre-allocation stop loss engine to include periods that are outside the portfolio’s training data, but are included in the longer term SP data that is available. When that article is published I will provide a notice in this blog and summarize those results as well.
We may be a long way from the bottom. Or not, we will have more clarity over the next few weeks and months.
OCTOBER 1, 2022 UPDATE: NEAR ANOTHER TIPPING POINT
The PCE numbers came out yesterday. The year-over-year value was down slightly, but the core was up (a key FED inflation metric). Employment (another key metric for the FED) is hanging in there giving the Fed more room to maneuver. Bottom line is that the FED will continue to raise rates to curb inflation. The market is increasingly aware of that fact and all asset classes dropped again. Looking at historical metrics for the SP that the stop loss engine includes, we are nearing a tipping point toward a potential further drop of almost 30% which would be a total peak to trough of around 50%. That has occurred only 2 times since the great depression: the tech bubble burst and the financial crisis. As noted in the previous update, the stop loss engine did re-enter the SP recently, but is closing in on another exit point. The stop loss engine operating on the InvestEngines allocation portfolio is also currently invested as noted in a June update. But the training data for the portfolio only covers about 20 years while the SP stop loss engine covers 90 years. And neither set of training data fully matches today’s conditions. Given all the other uncertainties in the world right now, it is difficult to be sanguine about the near term upside. Big questions remain: When is the bottom and how much lower will it be. Once a bottom is in place big opportunities will appear. I’ll have more on that later.
SEPTEMBER 23, 2022 UPDATE: FED INCREASES ANOTHER .75%
On September 21st The FED announced another .75% rate along with a higher dot plot and more hawkish language. The market took it badly. The SP is now down a bit over 20% from its all time high. The question remains of what lies ahead. Looking at 100 years of data from the most global stop loss engine, it appears the SP has a 40% probability of another 5% to 10% before bottom. But a 60% chance it will drop another 20% to 30%.
The stop loss engine had earlier exited the market at 4,250. However, it chose to enter back into the market on the 23rd at the 3,693 close, with the caveat it will get back out if another 10% drop does occur. At that point a 50% decline from peak is almost assured given historical stats.
The mean deviation of price also indicates there is a lot more down side. The closest period when price spiked above the long term trend as much as it did earlier this year occurred at the peak of the dot com bubble and the lead up to the financial crisis. The drop from those peaks was 50%.
So does one jump back in as the model suggests now, or assume far worse is yet to come? Interest rates are still well below inflation. The FED’s language indicates it will continue to raise rates. Add in all the Geo-political uncertainty with an upcoming mid-term election and it’s difficult to be sanguine about a near term upside.
The SP closed at 3,693 on Friday the 23rd. If it falls below 3,250 chances are it’s on its way toward the mid 2,000’s. Every component of the benchmark diversified portfolio has dropped more than 20% from its peak, except for short term bonds which dropped only 15% in value. Extreme caution seems the best path forward. A significant decline in inflation will be required to change that outlook.
SEPTEMBER 3, 2022 UPDATE: IT COULD GET UGLY
The recent market rebound has given up most of those gains in the past couple of weeks and the longer trend is down.
It is worth reviewing the 4 layer stop loss engine results for the SP500 over the past 93 years. The stop loss engine has historically offered improved performance in market downturns. On August 19, 2022 the SP500 stop loss engine, operating on its 90+ year training data set, got out of the SP500 at 4,220. However, the learning machine portfolio allocation engine and its stop loss engine did not generate any new signals since the June 11th update.
The training data for the allocation engine and the portfolio stop loss engine have not included a period of rapidly rising inflation expectations and rising interest rates from near zero (over the past 25 years). But the stop loss engine for the SP500 has encountered such periods over the past 100 years. The fact that the allocation engine is still over-weighting US equities, but the SP stop loss engine is "out" implies 2 things: caution is warranted and the learning machines need some improvements, including integrating training data over a broader set of conditions. (Note: The SP stop loss engine didn't improve returns when the market went on a huge uptrend after the financial crisis. So clearly the current stop loss engine needs upgrades as well, likely with more variables thrown into the mix.)
Behind all the metrics, the market drivers add to the uncertainty. The FED’s posture remains hawkish, driven by it’s over arching goal of curbing inflation. The employment figures remain relatively strong, so the expectation is that the FED will continue to tighten (raise interest rates and shrink the balance sheet). This was reinforced by the FED chairman's comments recently. Until there is a major hit to employment and a clear decline in inflation, expectations are that the FED will continue to take actions intended to slow inflation, with the hope of not pushing the economy into a recession.
The short term portfolio models suggests we should see a persistent bottom in the one year return sometime over the next 6 months or so. The chart below shows the short term model rolling 1 year annual return of the learning machine portfolio over the past 25 years. The red line is the training data (which ended at the beginning of 2022), the blue line is the model data, the red star is today's 1 year return of the learning machine portfolio and the blue star is the benchmark portfolio. Note that the recent peak was at the beginning of 2022, so it is not surprising that the projected 1 year return of the portfolio will bottom out toward the end of the year, although that may not indicate a bottom to the market.

Where and when the broad market bottom actually occurs is an open question. The estimate presented in the May update below was in the low to mid 3,000’s for the SP500, which would be another 15% to 20% lower than today. If a lot of bad things happen (e.g. rising unemployment, persistently high inflation, rising interest rates, declining GDP, discord or violence post 2022 mid-term elections, a prolonged Ukraine war, high energy prices, the China/Taiwan conflict erupts, or another "black swan" event) then the bottom could easily be in the low 2000’s or about half of where we are today.
So what would that look like? Below is a plot of the SP500 from the 1940’s until 2022. The black line is the exponential best fit to the data. I’ve superimposed a projected future SP trend line (black box in upper right) if the scale of the 1970’s market drop and rebound re-occurred now. This scenario is not as bad as the financial crisis, but worse than the pandemic drop (which benefited from a rapid and large fiscal and monetary response to COVID). In this “mid-range” scenario, the SP would bottom out in the mid 2,000’s within a year from now and wouldn’t recover to trend for 3 or 4 years. The SP stop loss engine indicates that if the SP drops to the low 3,000’s, there is a heightened probability that it will drop further into the mid to low 2,000’s. Let’s hope not, but there certainly is ample reason to be cautious at the moment.

Unfortunately, this cautious view is further supported by the long term models discussed in an earlier article that projects below average 10 year returns in the decade of the 2020’s.
JUNE 16, 2022 UPDATE: NOW THINGS GET “VERRY” INTERESTING (apologies to Laugh In’s Artie Johnson)
Let’s start with the fact that the FED just raised interest rates by 75 basis points. The largest increase in decades. Interest rates are still below “neutral” and very likely to rise further with high inflation and sustained worldwide geo-political uncertainty. The market jumped, ostensibly because the market expected the FED action to sustain the fight against inflation. The stop loss engines for the SPY and the learning machine portfolio both jumped back in from cash a day prior. Very interesting.
These primitive learning machines have limitations. They build on long term statistics and probabilities. They can’t always be right, especially in the short run. Over several years they can help significantly. Right now, I’m skeptical in the near term. The clarion clear warnings are still in place. Volatility is rising. Inflation is rising. The FED funds rate is still way behind inflation. Historically, valuation has never come off a previous high without declining down to trend or below, which would put the SP500 at 3200 or lower at the bottom. So another 20% decline from where we are today (3675) is still very much in play.
JUNE 14, 2022 UPDATE: SP500 ENTERS BEAR MARKET TERRITORY
The market decline on Monday pushed the SP500 into bear market territory that puts it over 20% below its previous peak. So what does that mean for the near future. It's anyone's guess, but here are the probabilities: 20% chance this is close to the bottom, 20% chance we have another 10% to 30% to fall, and a 60% chance of no more than 10% further to drop. The one additional point to consider is that the SP is coming off a period of relatively high valuation and could easily undershoot historical valuation metrics, which would indicate more decline to come.
The learning machine portfolio is still in cash (but it is less volatile than the SP500) and could jump back in soon. So stay tuned.
JUNE 11, 2022 UPDATE: ANOTHER SIGNIFICANT DAILY DECLINE
The SP declined almost 3% on June 10th and is at 3900 and flat but volatile for the past month. In looking at almost 100 years of SP data the SP would have to drop further to get to its "normal" valuation (viz. mean deviation of 0). It has never been this high above normal and not gone back to normal within a year or so. So it would have to drop to about 3200 (or about -18% from today) to get to neutral valuation around the end of 2022.
The learning machine portfolio did have a recent small re-balance, but the stop loss engine has it still in cash so it is a bit of a moot point until it jumps back invested. Below is the current asset allocation.

MAY 18, 2022 UPDATE: IMPLICATIONS OF TODAY'S 4% DROP IN SP500
With today’s 4% drop in the SP500, the first question you may have is how much further can the current market decline go. The stop loss engine that moved the learning machines’ target portfolio into cash a few weeks ago is still in cash (see the April 25th update below). The portfolio would have dropped another 6% in value if you stayed invested since then. So have we reached a bottom or as “The Marathon Man” asked, “is it safe”?
To answer that question, I took a deeper dive into the data. The learning machine portfolio has the best signal to noise ratio and as a result derives the most benefit from the stop loss engine. And as mentioned in the April 25th update the most likely future meant a further decline. An all-clear signal could be possible with a further 4% portfolio decline after today. But the training data the learning machine used is limited to 20 years. So I wanted to look at data over a longer period of time and with even more parameters.
I’ve built a deeper stop loss learning machine that looks at the SP500 since 1929 with more variables. And the short story is that things could get substantially worse from here. Without getting too deep into the model’s weeds here is the big picture. The market is overvalued and the time averaged price velocity has gone negative and a decline of almost 20% has already occurred. We are not at historical extremes (although valuation is coming off a 3rd place high), but these matters deserve increased attention. There is a 50/50 chance that the SP will only drop another 5% or less before bottom. There is a very small chance (around 10%) that a another drop of 20% to 30% could occur (think financial crisis or the great depression). Hope for the best, plan for the worst.
Here is all the data summarized in one graphic covering the last 93 years of the SP500. The bottom plot shows the effect of the stop loss engines. It moves to cash during periods of market decline and then re-enters at points in time that the learning machine found yielded the most consistent benefit over the full 93 years.

APRIL 25, 2022 UPDATE: LEARNING MACHINES MOVE BACK TO CASH
This update is a cautionary tale. The learning machines are now in cash (as of 4/25/2022). The drop from the most recent peak is now at a low (-12%) that has only occurred 3 times in the past 25 years. Two of those times it dropped significantly further; by another 5% to 11% further. There was a recent (April 4) modest reallocation that would have made little difference to returns at this point. The current allocation is shown below, but if the stop loss engine is considered, it would all be in cash temporarily. Consider that a warning about near term volatility and possible further declines.

MARCH 16, 2022 UPDATE: LEARNING MACHINES EXIST CASH MOVE
The good news is that the markets bounced off that shallow bottom quickly and the learning machines metric quickly reversed. Given that the circumstances discussed below are likely to persist, there is no telling what comes next. Keep in mind that the models of the learning machines were taught to maintain long term returns at a higher and more consistent level than buy and hold. During periods of market volatility, returns will be volatile as well and can't be eliminated with asset allocation alone.
MARCH 14, 2022 UPDATE: LEARNING MACHINES GO TO CASH
For only the 4th time in 25 years the learning machines’ go-to-cash warning has occurred. Of the 3 previous times it has occurred (1998, 2018 and 2020) the portfolio lost another 7%, 3%, and 11% in value respectively. I will update here when the invest signal returns. In all cases, the return to an invested state happened in less than 5 trading days. On those occasions, the excess return was 5%, -2%, 10% respectively as the learning machine returned to a fully invested state. The longest time to reach the trigger point was the 2018 event which didn’t generate any net benefit and fell the least to its ultimate bottom. This current trigger point has occurred faster than in 2018, but longer than the other 2 events which were sharper and deeper than 2018. Hopefully, this drop will not be too deep, perhaps between 3% to 7% further. But reading the very limited statistical tea leaves, the portfolio value could fall another 5% to 10%, or not.
MARCH 12, 2022 UPDATE: LEARNING MACHINE EARLY WARNING
We are at the cusp of a confluence of geopolitical and economic issues along with learning machine metrics that do not portend well for the near (and perhaps longer) future.
1. Economic issues: Low interest rates that are certain to rise, high inflation that could persist, and even stagflation.
2. Geopolitical issues: Russia-Ukraine war and increased east-west isolation with significant trade barriers.
3. Learning machine metrics: We are nearing a tipping point in the learning machine metrics that indicate diversification may be insufficient to protect near term returns.
There is nothing I can say regarding the first 2 sets of issues that isn’t already being broadly discussed in the media. However, the learning machines could provide some guidance about what the likely investing environment may be. So let’s dig in.
The first issue is that within the next few trading days, a very rare learning machine metric may well trigger going to cash. It has occurred only 3 times in the last 25 years.
1998 (Asian financial crisis)
2018 (potential China trade war and slowing growth)
2020 (pandemic)
Surprisingly, the financial crisis of 2008 and the tech bubble burst of 2000 got within a hair’s breadth of triggering the same move to cash, but never did. The asset allocation remains unchanged since the January 17, 2022 update below.
That said, it is very difficult to ever benefit from moving to cash because events happen so fast. For instance the times in the past that the learning machines stayed in cash averaged less than 5 trading days. These severe market drops tend to be rapid V shaped events at the very bottom. But the benefit in terms of excess return (by getting back invested at a learning machine trigger point) has averaged about 6% because the pandemic decline was so sharp and deep.
The final bottom averaged another 8% (4% to 12%) below the first trigger point and it took 4 to 5 months longer to return to a previous peak. For most investors this is not a time to react, but it is a snapshot of a likely further drop in returns and ultimately it may offer guidance as to when to keep your powder dry and when to take a more aggressive investing stance.
All these stats are based on the learning machine’s optimum portfolio allocation which had the best long term statistics. The 60/40 portfolio had similar cash trigger time frames and is currently near its own trigger point.
One more concerning development is the potential that we are entering a period of stagflation. It is a situation we have not encountered since the 1970’s. The learning machines' training window didn’t include that time frame (it began in the late 1990’s) as the data was not available for the individual asset classes used for training. So I’ve gone back and built a similar learning machine that begins in the 1920’s, but uses only 2 asset classes (equities as represented by the DOW and bonds as indicated by 3 month treasuries) to get a sense of what a window of stagflation might mean in terms of return levels.
The learning machine allocation cycles returned almost 8% per year, while the 60/40 portfolio returned just over 3% in the decade of the 1970's. But don’t get too excited. Interest rates rose dramatically in those 10 years to nose bleed levels from a starting point in the high single digits. Along with inflation at all time highs, real returns (actual returns minus inflation) were negative. Short term bond yields really helped overall returns as equities under-performed. Those conditions are nothing like today and may mean much less help from bond yields.
To explore a scenario that may look more like conditions now, I simulated today's bond yields and trends for the period of the 1970's in the learning machine. The results were not surprising. We may be embarking on a volatile 10 year period with low single digit average returns for equities and bonds, think 2% to 4%. The learning machine allocation simulation does yield results at the high end of the range. So real returns could average negative over the decade of the 2020's. This is similar to what all the long term modeling we've reviewed in this blog suggests as well. For the past 100 years we have never been exactly where we are today.
If the learning machine does trigger the "go to cash" event soon, I will update things here. But remember trying to time the market to advantage is not a high probability strategy. The rare times it is beneficial is if the drop is long and very deep. Rather consider this event signal as a general indicator of what may lie ahead and how to prepare your investments over time.
JANUARY 19, 2022 UPDATE: SMALL ASSET RE-ALLOCATION
The learning machines have made a small update to asset allocation shown below and dropped gold and ex-US equities to zero (emerging markets were already at zero allocation). This is a small shift and shouldn't be taken as an absolute requirement to meet. Given we are likely entering a period of rising interest rates, I do need to comment on the high allocation to the long bond. Clearly that is counter intuitive and the machines may adjust it down in the future, or they may be wrong. The one potential rationale is that as volatility rises, investors move to safety, which tend to be bonds, so it could reduce overall volatility in the portfolio. We shall see.

DECEMBER 31, 2021 UPDATE: END OF 2021
As the fourth quarter opened, it appeared the economy was beginning to recover as the virus was receding. The FED was finally beginning to shift to a less accommodating stance and could drive expectations and near term market performance. Then came the Omicron Variation as the year ended, increasing uncertainty.
The learning machine made a counter-intuitive reallocation at the end of October. It raised allocation to the long bond (to its historical average) and reduced allocation to ex-US developed markets. Expectations have been that interest rates will begin to rise in 2022, so one would expect the long bond to lose support. US equities remain over-weighted, although below historical highs. All other asset classes remain under-weighted. This was the second re-allocation of 2021, the first occurred at the end of Q1. The 12 month return of the learning machine for 2021 was 14.6% and the benchmark returned 4.6%
Current asset allocation is shown in the pie chart below.

The last window of time when the learning machines suggested a similar allocation was roughly from March of 2014 to March of 2019. During that period, the 3 month treasury yield began its rise from near zero shown below.

As interest rates lifted off their lows in 2015, portfolio returns ended the 12 months roughly flat, but things were very volatile with equity drops between 10% and 15% during that period. The learning machine allocation declines were about half that. Below is a plot of the portfolio's response to interest rates as they rose from near zero, with the first spike upward in August of 2015. It shows a volatile year ending with rising returns.

Time will tell if the learning machines' current allocation is maintained and similar results occur now.
OCTOBER 1, 2021 UPDATE: END OF Q3 2021
No change to the asset allocation from the June 16th update below. The return for the benchmark portfolio was 10.5%, while the return for the learning machine allocation profile was 20.4% for the trailing 12 months ending on October 1, 2021.
JUNE 16, 2021 UPDATE: ASSET ALLOCATION CHANGE
InvestEngines' suggested allocation changed on June 16, 2021. The new allocation increased the developed market ex-US asset allocation and reduced all others as shown below.

APRIL 1, 2021 UPDATE: NO CHANGE TO ASSET ALLOCATION, BUT THERE IS TO LONG TERM EXPECTATIONS
InvestEngines' suggested allocation is unchanged from the November 2020 values. Return for the last 12 months was 30.5% versus 26.4% for the benchmark. Both values are way above normal because the bottom of the market caused by the pandemic is no longer within that window.

As a reminder, the historical range of asset allocations is shown in the chart below and as you can see US equities are currently well over-weighted relative to their average weighting, as long term bonds are under-weighted.

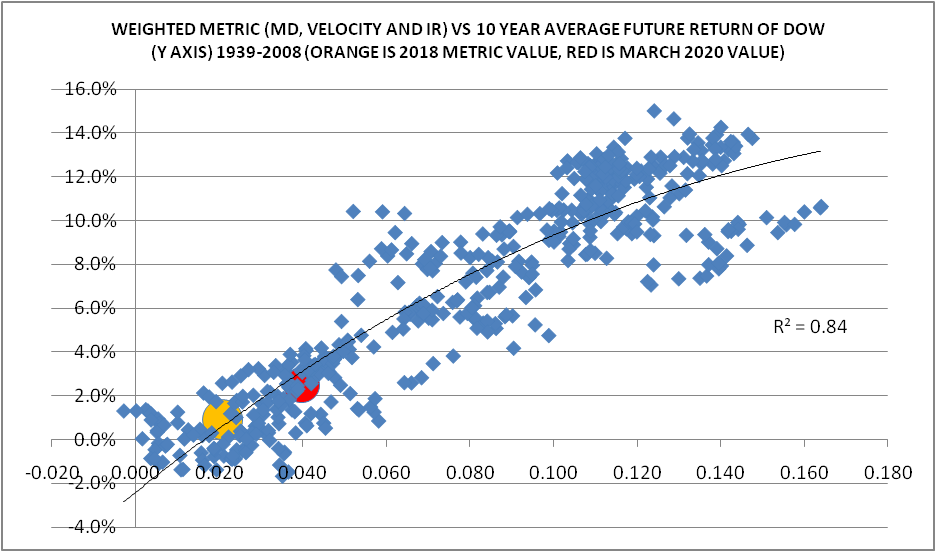
Given the dramatic drop and recovery of the market due to the pandemic it is probably a good time to revisit what the learning machines have to say about long term future expectations. The plot below is the updated 10 year expectation. (A more compete discussion of how the learning machine developed the future expectations model is discussed in previous article 7, titled Details.)

The X-axis is the learning machine aggregate metric for estimating future returns. The Y-axis is the actual 10 year future return. Its not rocket science to notice that since 2018 there has been a dramatic shift in the expectations of future returns. The metric has dropped below zero where the future returns have bifurcated. The current range of expected average returns over the next 10 years (yellow) runs from below zero to the high single digits. In fact, the learning machines had to expand the historical record to before the market crash of 1929 to encompass the current metrics. As you can see there is a huge split in the expected return scatter plot. It is worth a deeper dive to understand. The plot below may help explain what is going on.

It turns out that the lower expected return profile (in red) occurred leading up to the crash of 1929 and the better performing market (in green) occurred during the period following the new deal. So future returns may largely hinge on what happens monetarily with the FED and fiscally with the congress.
For those trying to discern what the next few years may look like with regard to expected returns on investments, I've added a new article, Climbing Further out on a Limb, that takes a more detailed look at shorter term expectations derived from more recent trends.
NOVEMBER 1, 2020 UPDATE AND NEW ALLOCATION SIGNAL
InvestEngines just delivered its first new allocation signal since May of 2020. (That May 2020 signal was a small change relative to the previous signal in October of 2019). I noted in the October 2020 update (just below) that it looked like it was likely to occur and it did. The new allocation, once again moves to significantly over-weighting US equities.

Although this new allocation was generated during the current election cycle, there is nothing in the learning machine model that uses signals from that event. The learning machines generate their signals from long term relationship trends in asset class pricing and interest rates to minimize least mean square error of uniform returns. Keep in mind that although the machines generate specific asset allocation signals, you should consider this machine guidance, your personal risk tolerance and investment goals should inform your final choices.
OCTOBER 2020 UPDATE
This update reflects the latest changes and corrections to the learning machines. Asset allocation maintains a fully diversified portfolio posture similar to the most recent updates. Of greater impact is the inclusion of a new asset class: gold. This was added to provide future exposure to an inflation hedge, since the possibility of inflation in the years ahead is quite plausible. As a result the new allocation looks different than the previous updates although the machine learning performance over the past 20 plus years is nearly the same. Keep in mind that asset allocation is an over-determined problem meaning there is more than 1 solution to optimal asset allocation over time. The key is to be consistent. Gold will be included in all future updates and I do not expect any additional changes to the underlying set of learning machines.
The current asset allocation is shown below and was signaled at the end of October 2019 and has been unchanged since.

HEADS-UP FOR END OF OCTOBER OR EARLY NOVEMBER 2020
As of this writing there appears to be a high likelihood that there will be a major reallocation signal occurring within the next 30 days. This is indicated by a slow moving and predictable parameter in one of the engines. If this occurs, as expected, the new asset allocation will dramatically increase allocation to US equities at the cost of all other asset classes except gold, which will hold close to its current weighting. Stay tuned.
CORONA VIRUS UPDATE JUNE, 2020
The asset allocation is close to identical to the previous update and is close to the October of 2019 settings with very minor adjustments.

But with the markets having recovered most of the drop since reaching the lows in March of 2019, it is worth a moment to look at some of the dynamics at play.
The virus is showing increased testing positivity, while also showing declining death rates which could be a sign of a mutating virus, improved theraputics, or lagging metrics. Only time will tell. The market's recovery seems to be somewhat decoupled from economic indicators. But near term future market expectations could be driven by at least 3 things: expectations that the economy will recover quickly as the virus's impact lessens and the economy opens, the major fiscal moves by congress to fill the hole in economic activity and the unprecedented level of monetary action by the FED. As noted in the Details article, falling interest rates are usually a positive for bonds and equities. As the FED expands the balance sheet it is equivalent in many respects to interest rate declines. And with the FED's recent actions the balance sheet has reached historically high levels as shown below.

So perhaps the old adage of never fight the FED is more relevant than ever. Only time will tell. Click here for more details on what may lie ahead.
CORONA VIRUS UPDATE MAY, 2020 This has been a crazy 2020. The Covid 19 has killed and the lock down has pushed the world to the brink of a possible economic depression. The market has been bi-polar. The learning machines had made some major adjustments that occurred late last year, prior to the market crash as you can see in the historical target allocation chart below.

Those changes were driven by the learning machines weighted relative strength dynamics at the time and the fact that the re-allocation predated the crash (and reduced its negative impact) was coincidental. The changes had the effect of reducing the peak to trough to -23%, because the recent asset allocation changes raised the bond holdings relative to equities (slightly higher than the benchmark 60/40 allocation). This is shown below.

Below is an updated history of the value of the benchmark portfolio versus the value of the learning machine allocation to the same assets. It is important to realize that using long term allocation methods is still vulnerable to short term volatility, although long term benefits are still possible.

As you can see below, the long bond 12 month return is well above its long term average. And the fact that the learning machines had recently over-weighted the long bond helped raise the return of the learning machine portfolio. The benchmark portfolio and the machine learning portfolio have positive 12 month returns of 1.9% and 3.2% respectively.

There is one glimmer of good news in all the bad news. The sudden and massive drop in the value of equities has improved the long term expectation of future returns, although they are still well below historical averages. This can be seen in the chart below.
The yellow value reflects what 10 year future return expectations were a couple of years ago. Since the +30% drop in equities from the corona virus, the expectations for future returns have risen slightly (red value). But 2% to 3% for average future equity returns is still nowhere near the past 20 years. And to dampen things further, with interest rates so low, it is unlikely bonds will help as much as they have in the past. For a complete explanation of this chart check out the Details page.
All that aside, bonds do offer lower volatility (the peak to trough for the aggregate bond fund was only -7%) and if these kind of recent market drops keep you up at night, then cash and bonds are your best long term sedatives. But for most, the short term damage has been done, and staying the course is your best bet, bonds generally move opposite to equities, so they will help reduce volatility. We are in uncharted waters relative to interest rates and it is very difficult to predict long term outcomes, let alone short term expectations given where we are starting from.
The current market is outrageously volatile with daily returns bouncing around values seen for a whole year. Expect more of the same until things become a bit clearer. The corona virus impact on the world economy is significant. It is a supply, demand and financial hit. And with equity markets dropping 35% peak to trough so far it still has not reached the level of decline that was experienced during the financial crisis (about 50% decline) or the great depression (about 90%). On a more positive note, monetary action by the FED and fiscal action by the congress are unprecedented in scale, which may help ameliorate the worst outcome.
Allocation Change October 2019
At the end of October, 2019 the learning machines generated a suggested change to the target asset allocation shown below. The biggest changes have been to increase to EX US equities (developed world markets outside the US), increase allocation to emerging markets and increase exposure to bonds from a total of 24% to 42%. Most of this change has come at the cost of allocation to US equities from 53% to 15%. This has moved overall allocation very close to the benchmark 60/40 allocation. The increase in bond holdings is a cautionary note although with bond yields near historical lows this is of even greater concern.
The previous allocation (below) change which the learning machines had suggested back in early October of 2017 had over weighted US equities for almost 2 years, until this most recent change.

These current values indicate that aggregate bonds and emerging markets are significantly under weighted, while long bonds are slightly under weighted. Developed markets outside the US and US equities are still notably over weighted relative to their 20 year average allocation. Except for emerging markets (0%), no other asset class is at an extreme weighting value relative to their historical ranges as shown below.

US equities lead the pack in terms of total return over the past 12 months and since the learning machines over weighted US equities over the same period that portfolio allocation outperformed the benchmark allocation as shown below.

Looking back at the last 20 years, the learning machines have provided target asset allocations that have outperformed the benchmark 60/40 allocation and with lower volatility. The learning machine allocation returned an average of 13.3% per year versus 7.9% for the benchmark. And the worst 12 month return for the learning machine allocation was -11%, while the benchmark 60/40 allocation had a worst 12 month return of -36%. Although equities are still slightly over-weighted relative to their historical average weight, they are well below their peak weights. Below is a graph of the target asset allocation from the learning machines over the past 20 years. Note that there has been less than one new target allocation per year and US equities have continuously enjoyed the highest target allocation since 2012.

As a reminder, here are some low fee funds and ETF’s that represent possible choices for each of the 5 asset classes in the benchmark portfolio. But feel free to search for other equivalent offerings, there are many.
US EQUITY
SWTSX, Schwab, fund, 0.03% fee
SCHB, Schwab, ETF, 0.03% fee
VTSMX, Vanguard, fund, 0.15% fee
VTI, Vanguard, ETF, 0.04% fee
EX-US EQUITY
SWISX, Schwab, fund, 0.05% fee
SCHF, Schwab, ETF, 0.04% fee
VTRIX, Vanguard, fund, 0.43% fee
VEA, Vanguard, ETF, 0.07% fee
EMERGING MARKETS
SFENX, Schwab, fund, 0.39% fee
SCHE, Schwab, ETF, 0.10% fee
VEIEX, Vanguard, fund, 0.32% fee
VWO, Vanguard, ETF, 0.14% fee
LONG BONDS
VUSTX, Vanguard, fund, 0.20% fee
TLT, iShares, ETF, 0.15% fee
AGGREGATE, INTERMEDIATE, OR SHORT TERM BOND
SCHO, Schwab, short term ETF, 0.05% fee
SCHZ, Schwab, aggregate ETF, 0.04% fee
SCHR, Schwab, intermediate term ETF, 0.06% fee
VBMFX, Vanguard aggregate fund, 0.15% fee
BND, Vanguard aggregate ETF, 0.05% fee
OUTLOOK for 2020 and beyond
Long term, (5 to 10 years) equity returns and bond returns are still both expected to be well below long term historical averages of around 8% and 6% respectively. We begin 2020 still expecting equities (represented by the historical data for the DOW) to offer average annual returns over the next ten years anywhere in the range of -2% to 6%. As shown by the red circle in the chart below.

As noted before, it is a fool’s errand to try to predict what will happen in the near term with any significant accuracy. 2019 was a banner year helped along as it began after a major equity decline at the end of 2018. And it was further helped when the FED reversed course in 2019 and began lowering short term interest rates and ending its balance sheet contraction.
Elevated valuations, geopolitical uncertainties and the 2020 election make this coming year exceedingly difficult to handicap. That won’t prevent the “experts” from at least trying though. Here is the end of the year survey of Wall Street predictions from Bloomberg. Even if these predictions are not helpful quantitatively, they do provide a qualitative rationale for future possibilities.
The learning machines of InvestEngines can only react to what actually happens, they are not a predictor. 2020 begins as it began 2019 still over-weighting equities (with the exception of emerging markets) and under-weighting bonds. Only time will tell if this suggested asset allocation by the learning machines is maintained or even proves to be optimal in the near term.
INTERIM UPDATE, NOVEMBER 22, 2019
At the end of October one of the learning machines had an asset allocation change signal. The most obvious change raised the weighting of the ex-US asset class. It is shown below and you can compare it to Q3 update values. The increase of allocation to the ex-US asset class came at the expense of the US assets and to a lesser degree from bonds.

The past 12 month performance (as of this update) reflects the bottom falling out of the market at this time last year, so it reflects a better than average, 12 month returns of 11.9% for the benchmark portfolio and 16.5% for the learning machine allocation. As a reminder, it is not necessary to re-allocate to the these precise weightings, but use them as a general guide.
UPDATE Q3, 2019
Since the previous update the learning machines have learned a few more tricks. They have evolved by competing against other learning machines. The result is a more intuitive output that provides a specific set of recommended asset allocation weightings by asset class. The new output also optimizes a broader set of cost/utility function values, which now include average returns, volatility, return uniformity (RSQR) and worst case 12 month draw-down. The "details" discussion covers the current learning machine methodologies in more detail.
At the end of the 3rd quarter the benchmark portfolio returned 4.1%, while the learning machines returned 5.6% for the last 12 months. The current asset class allocations suggested by the learning machines are shown in the chart below.

These asset allocation are as follows: Emerging markets allocation is 0%, US equities allocation is 64%, ex-US equities allocation is 4%, aggregate bonds allocation is 9%, and long term bonds allocation is 23%. Keep in mind that the long term difference in the performance of the portfolio using these asset class weights versus just using them as a rough guide is small. Don't succumb to the need to use these precise values, but rather use them as a general guide to asset weighting. Chasing short term benefits of asset allocation using a long term tool is a fools errand. The last re-balance signal was about 2 years ago and that is second longest uninterrupted run in the past 20 years (the longest run between signals was from after the tech bubble recovery until the financial crisis).
The current asset allocation falls well within the historical extremes as shown in the graph below. The maximum, average, minimum and current asset allocation that the learning machines indicated over the entire historical record of the portfolio is presented.

Over the last 12 months the FED reversed course on raising interest rates and began lowering them in anticipation of a slowing economy. Given this sudden change, there was a spike in the value of bonds which made them the asset class with the best 12 month performance. For the trailing 12 months, the learning machines' allocation did outperform the benchmark although bonds alone dramatically outperformed both. The learning machines are designed for the long term, with an emphasis on consistency of returns, minimal annual draw down and the maximum ratio of return to volatility. So time will tell.

The current market valuation is still elevated, interest rates are still close to historical lows with the path forward very unclear, and geopolitical conditions are unstable, so the near term is very uncertain. The actionable risk metric from the long term learning machine is still not elevated, but things could change quickly (see the Q1 2019 update below). So stay tuned.
I was recently asked about what steps could be taken to deal with fact that future returns for the next decade could average 2% (+/-4%), which is well below the previous decade. But if we are lucky and interest rates do not rise substantially in the next decade, today would look a lot like the early 1940's, and future returns then were at the upper end of the lowered range, around 5% per year for following 10 years. So not all hope is lost. And if markets don't move in a straight line, a tool like InvestEngines, could take advantage of asset class trend shifts and raise that average a bit higher.
RECENT PAST UPDATES
UPDATE Q2, 2019
The second quarter ended much like the first quarter, with the learning machines still over-weighting US equities. The past 12 month's return of the balanced portfolio was 3.3% as of June 28. The machine weighted portfolio (all in US equities for the entire period) returned 6.6% over the same period. The long bond out-performed all asset classes and marginally outperformed US equities in the prior 12 months. This was largely the result of the expectation that the FED may lower interest rates going forward. The learning machine relative strength metrics have not reflected that shift as shown in the chart below, due to the long term nature of that metric. Actionable risk levels for US equities remain suppressed, but expected long term future returns remain at very low levels, well below past averages.

As a reference, these are the 20 year historical results from 1998 to 2018: The equally weighted benchmark portfolio returned 8% per year, while the same set of assets returned 13% per year when asset allocation followed the learning machines suggestions. Volatility was reduced from 11.3% to 6.7%. Max draw-down (daily rolling 1 year value) was reduced from -36% to -13% respectively. The benchmark portfolio had a negative annual return (daily rolling 1 year value) 22% of the time, while the learning machine reduced the negative return to 4% of the time.
Some final words of caution for any active asset allocation strategy, including expert advice or machine learned indicators. Nothing can always work, regardless of "historical" evidence. InvestEngines is designed for the long term investor, with a broadly diversified set of assets. That means it will not respond to rapid changes like a flash crash when markets collapse dramatically over a few days or weeks. Nor will it likely provide any benefit if all asset classes perform similarly with changes that are small over the long run. Any active strategy that seeks some advantage, incurs potential costs, including losses and tax liabilities for taxable accounts. Over the past 20 years, the average time between major alerts generated by the learning machines was between 1 and 2 years.
See the article titled DETAILS for all the learning machines' historical output, what they mean and how they are derived.
UPDATE Q1, 2019
Current Asset Allocation
The learning machines have maintained and are sustaining the maximum asset allocation to US equities. US equities have returned 7.4% for the past 12 months, whereas the benchmark diversified portfolio (5 asset classes with 60% equities 40% bonds) has returned a negative -1.1% over the same period. Below is the relative strength trend for the 5 asset classes over the past 6 months. Clearly US equities show significant relative strength advantage, although the trend has declined relative to aggregate bonds and to a lesser degree, emerging markets. (Even if the relative strength lines do eventually cross, the learning machines have "learned" in the past that its been better, fewer trades and more consistent returns, to wait before actually suggesting a change in asset allocation. That information will be included in this post if and when the learning machine generates such a signal.)

Future Expectations for Equities
We are still at a point of low expectations for future 10 year average returns. In fact mean deviation has continued to rise and we are now at +15% on the x axis on the chart below. So we can expect 10 year future returns to average below 2%. Given the recent pause in the FED's raising of interest rates and talk of pausing the balance sheet decline, we can expect bond returns to continue to look better relative to long term equity returns, although year to year equity returns can be very volatile.

Future Expectations for Bonds
As noted above, the FED's expectations of interest rates has changed recently.
An aggregate bond fund is yielding around 2.8% and a long term bond fund is yielding slightly less than that at about 2.7%. This is called an inverted yield curve (when long bonds return less than short term bonds) and is seen as a harbinger of a future recession, although the data is mixed. But given the elevated mean deviation and its indications for future returns, this may be a time to pay close attention to asset allocation. As you will see in the discussion on the current benchmark portfolio asset allocation below, the aggregate bond fund is showing recent signs of relative strength.
Risk Level
Short term risk to an actionable rapid market decline is still at subdued levels as shown in the chart below. This metric is derived from 2 learning machines. The first machine solely uses asset allocation to achieve the most consistent returns over time, the second machine uses mean deviation applied to the first learning machine to determine if cash (get out of the market altogether) can ever improve matters. As noted in other posts, adjusting asset allocation is usually sufficient to deal with market shifts, but there is some marginal benefit (slightly improved average returns and consistency) to monitor this risk level and use cash on rare occasions (red line). In general, it is a cautionary signal.

UPDATE JANUARY 18, 2019
Future Expectations for Equities
Currently we are still at a point of low expectations for future 10 year average returns. In the chart below we are at the +14% point on the x axis, which means the next ten year average annual returns will likely be in the +2% range (with extremes from -2% to +6%). Take out inflation, taxes and fees for net real returns. (It's worth noting that if interest rates move upward significantly, likely returns will be at the low end of the range. This means equities may not average much better than an aggregate bond fund, which has lower volatility.)
Future Expectations for Bonds
If rates stay roughly constant, then total returns in the 2% to 3% range for an aggregate bond fund is probably a reasonable guess. If that level of return is sufficient for your long term plans (see Monte Carlo article), then it may be a safe place to go, just remember if rates and inflation jump up, then total returns of bond funds will drop, even though the yield in annual dollars stays the same.
(Total returns for bonds will track inversely with interest rates and no one knows what the FED will do or if a recession will come our way. If the FED continues to aggressively raise rates, then bond total returns will decline. Today there is hope the FED will pause or slow down interest rate hikes, but more increases are expected in 2019. If a recession occurs and the FED introduces more rate reductions this will raise total returns, but not as much as in the past, given we are starting at relatively low rates today. If you would like to explore the effect of changing interest rates on total bond fund returns over various time frames, try this very simple Excel calculator I built to do just that.)
Current Asset Allocation
The learning machines have maintained the maximum asset allocation to US equities. Below is the relative strength trend for the 5 asset classes over the past 6 months. Clearly US equities are over weighted, but the trend has turned negative recently. The only asset class that is showing a strong positive shift in upward trend is the aggregate bond fund (viz. VBMFX).

Risk Level
The chart below shows the most recent 6 months level of risk. Although the December declines and increased volatility raised the risk metric recently (grey line), it has not risen to the level of taking action (red line). This a relatively fast acting metric that may generate an action soon, especially when the indicator is rising. (However, it doesn't generate a signal very often and the most recent actionable risk level was in the 2015-2016 period of market volatility and decline. You can see the entire historical record here.) It is worth paying attention and consider it as a warning light.

For the last 12 months (January 18, 2018 to January 18, 2019, the benchmark portfolio returned -9.5% while the learning machine weighted portfolio returned a -5.7%, which had full exposure to US equities the entire time.


Comments